Data curation
In this tutorial only the most common data types will be shown. For more information, see Data Curation.
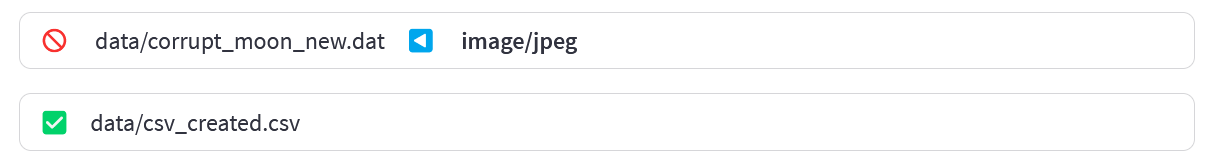
With a running web report you can see the status of your data.
The most common types of errors reported by solidipes will be illustrated below.
Solidipes checks whether the mime-type corresponds to the extension of the file. (i.e. an image file with a .dat extension will be flagged as an error).
Since different file types use different loaders. You must tell solidipes with which loader it should interpret the file when the extension does not match the mime-type.
You can do this by either specifying which extension it should be interpreted as
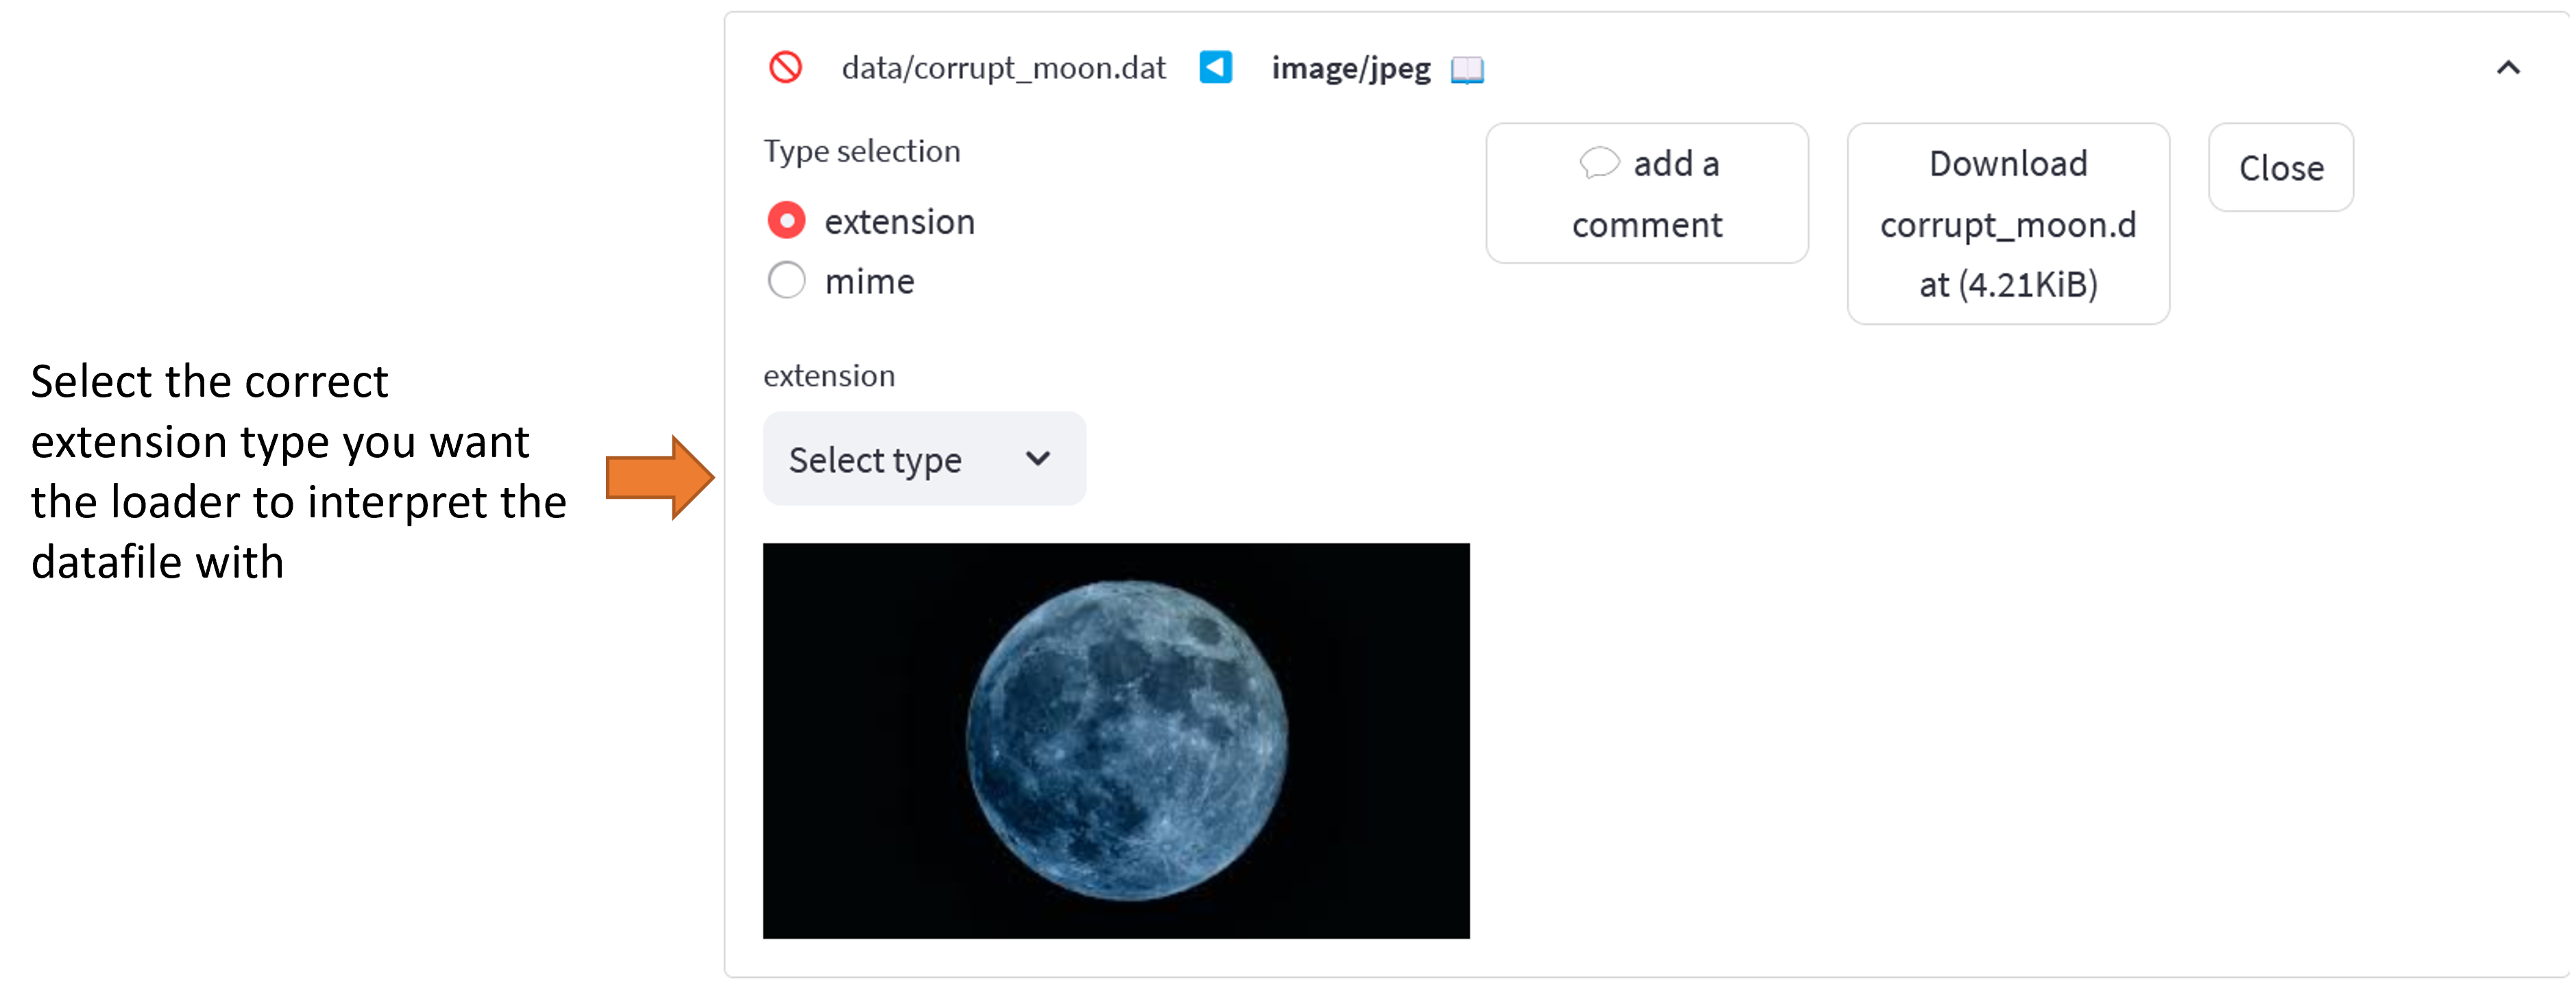
or by specifying which mime-type it should be interpreted as.

Attention
Changing the actual file extension must be made manually. In the web report you only inform of which loader should be used, but the local filename will remain unmodified.
After local changes, refresh the webpage, click on the Force folder scan button, or run the web-report command again.
Aside from the extension and mime-type, solidipes also allows more type-dependent checks.
See here:
For images
For tables
For pyvista meshes
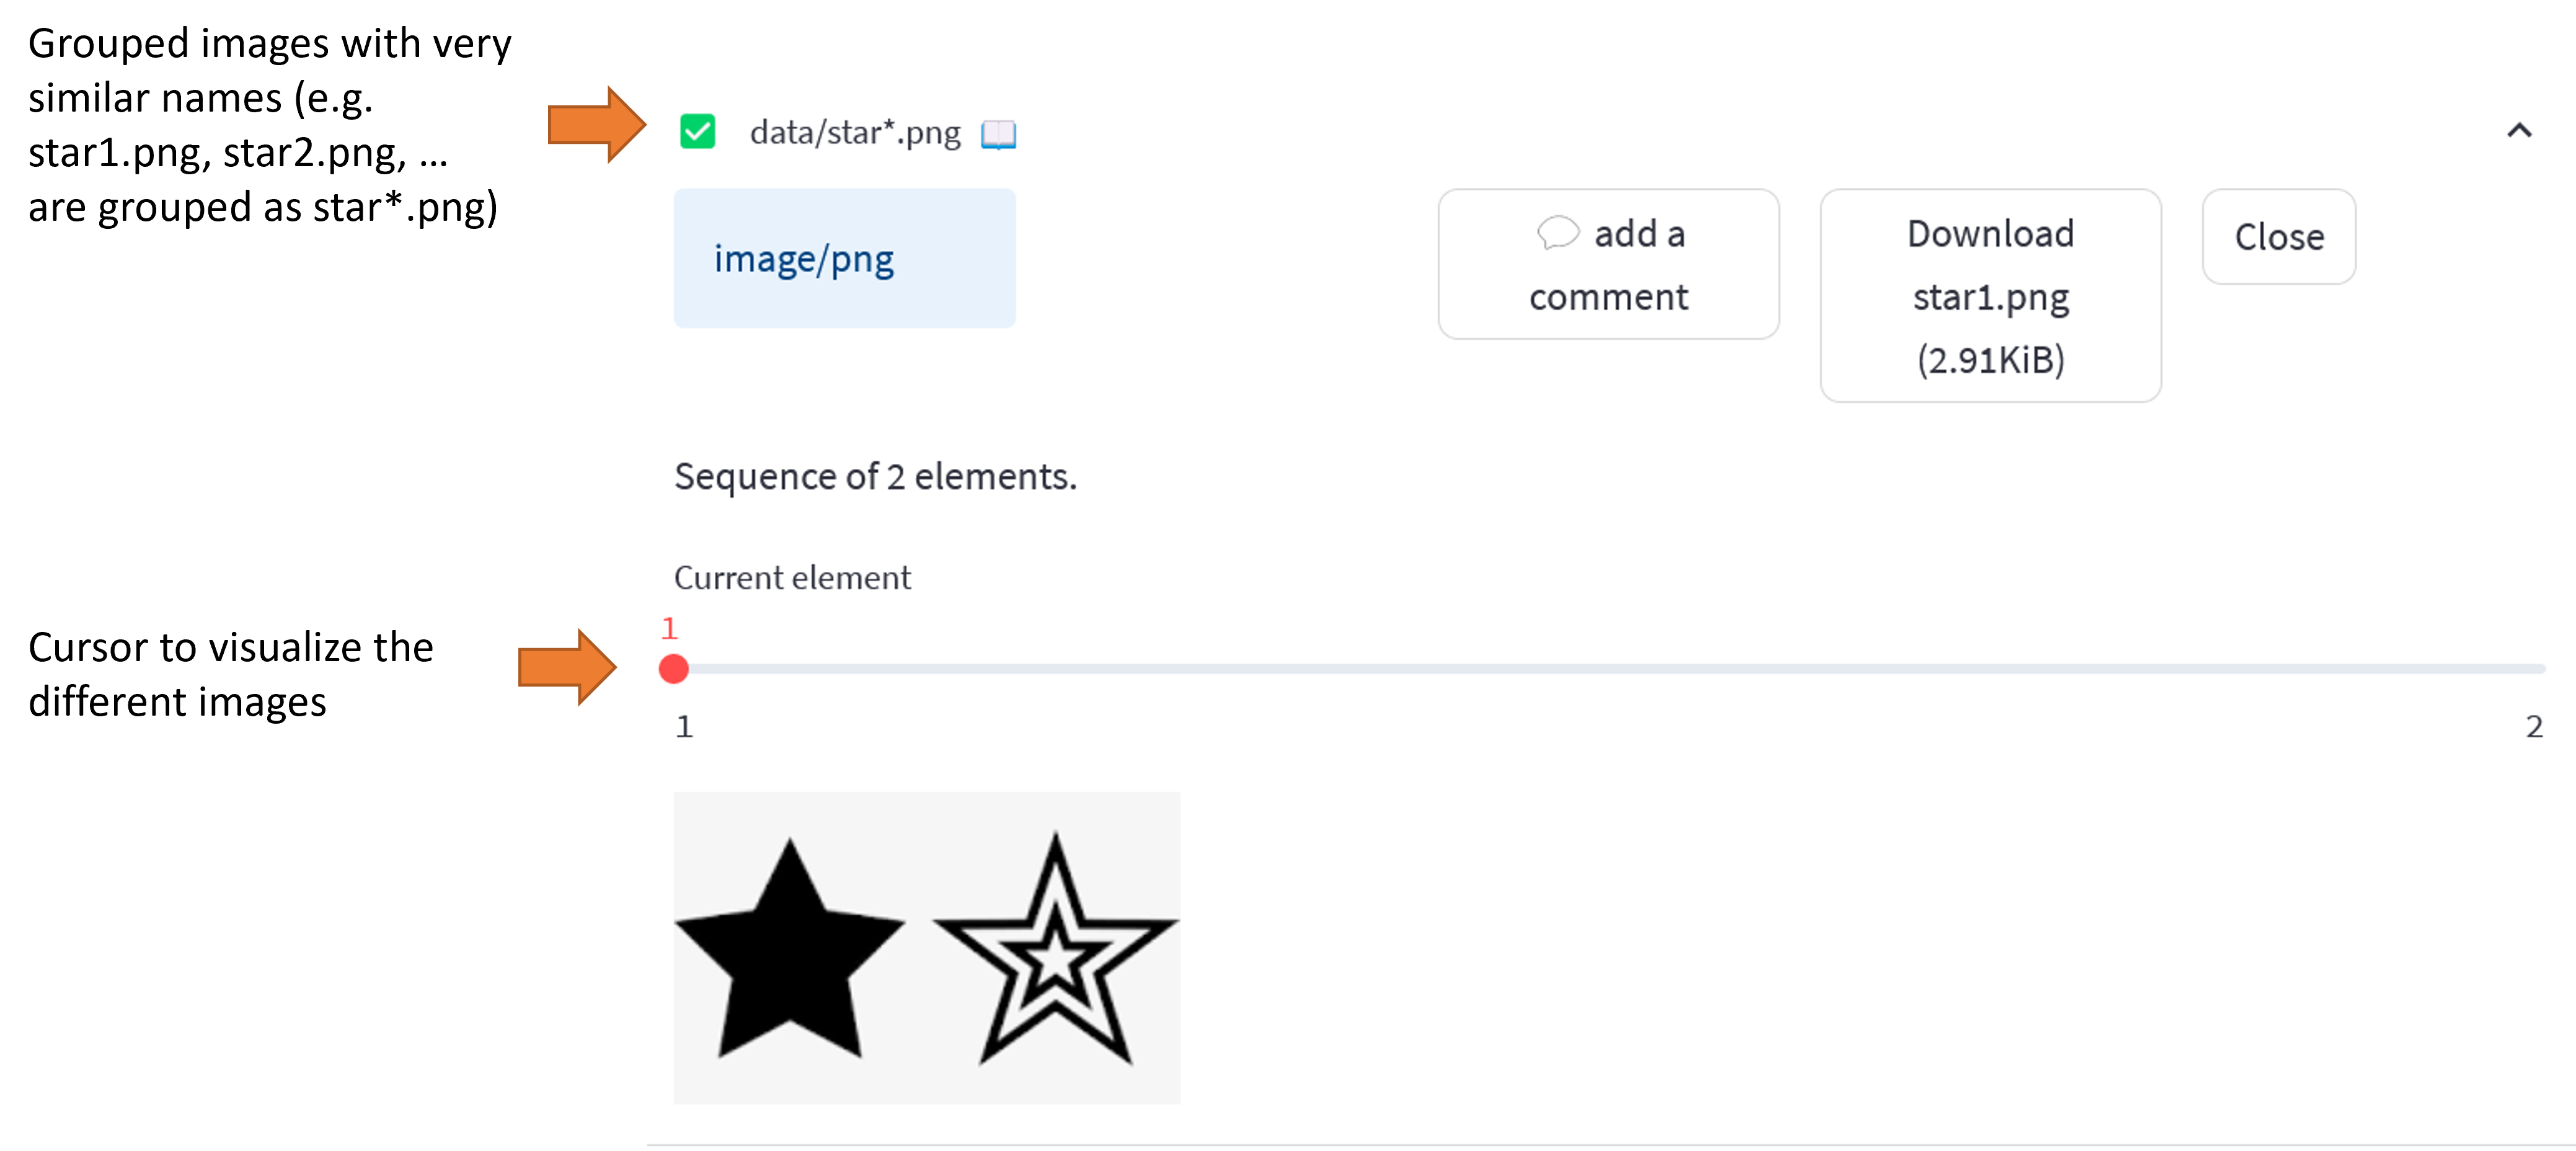
Data grouping
If you have a set of data with a similar name (i.e. img1.png, img2.png, img3.png, etc.) solidipes will group them together (i.e. img*.png). This is useful, for example, if you have a set of images that are related to each other. For example, if you have a set of images or tables that are the result of a simulation, you can group them together, so you can use the cursor to visualize your data.
Attention
If one of one dataset of the sequence is missing, solidipes will not warn you, instead it will create two separate groups (i.e. img1.png, img2.png together and img10.png separately).
If you want to see the status of each dataset individually, you can click on the group and it will show you the status for each.
Here you can see images grouped together, if you do not want this, you must change the names locally.
Image curation
The webreport allows you to visualize your images. If the image is corrupted, you will not be able to see it.
Attention
.gif and .tiff files are shown as individual images grouped together and not as a gifs or tiffs.
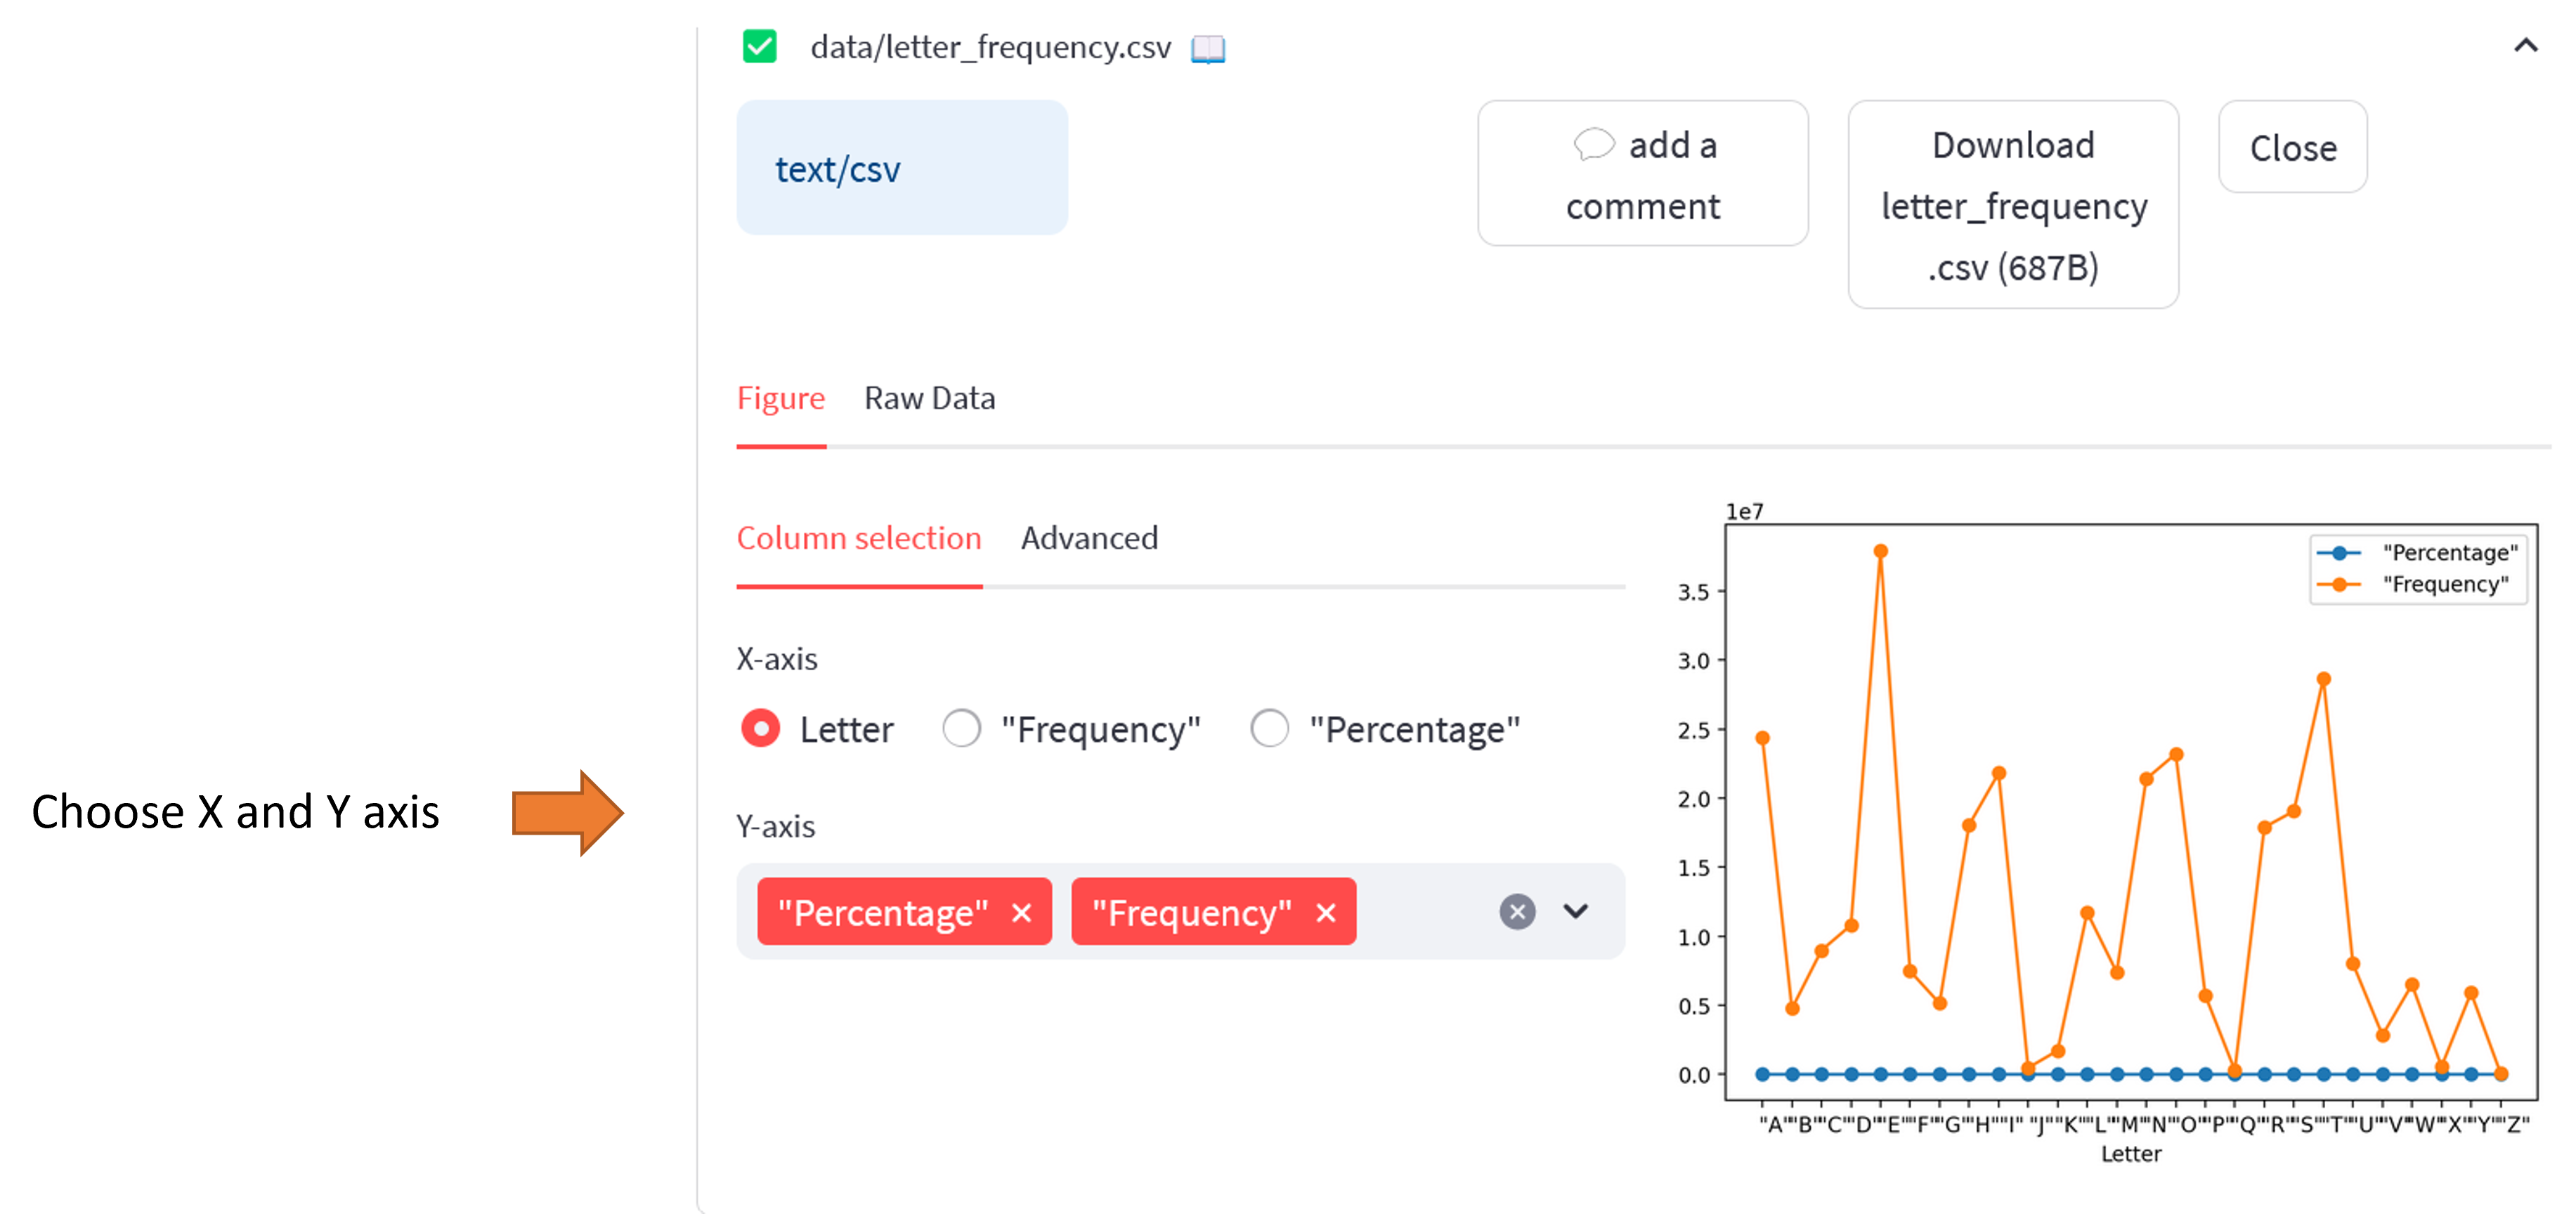
Tables curation
When visualizing the tables (.csv and .xlsx files) you can check for the following:
If the file is empty
If the file is a valid file
If the file is a valid table (i.e. if it has a header and a body)
The table will be visualized in the web report, so you can check if the table is correct.
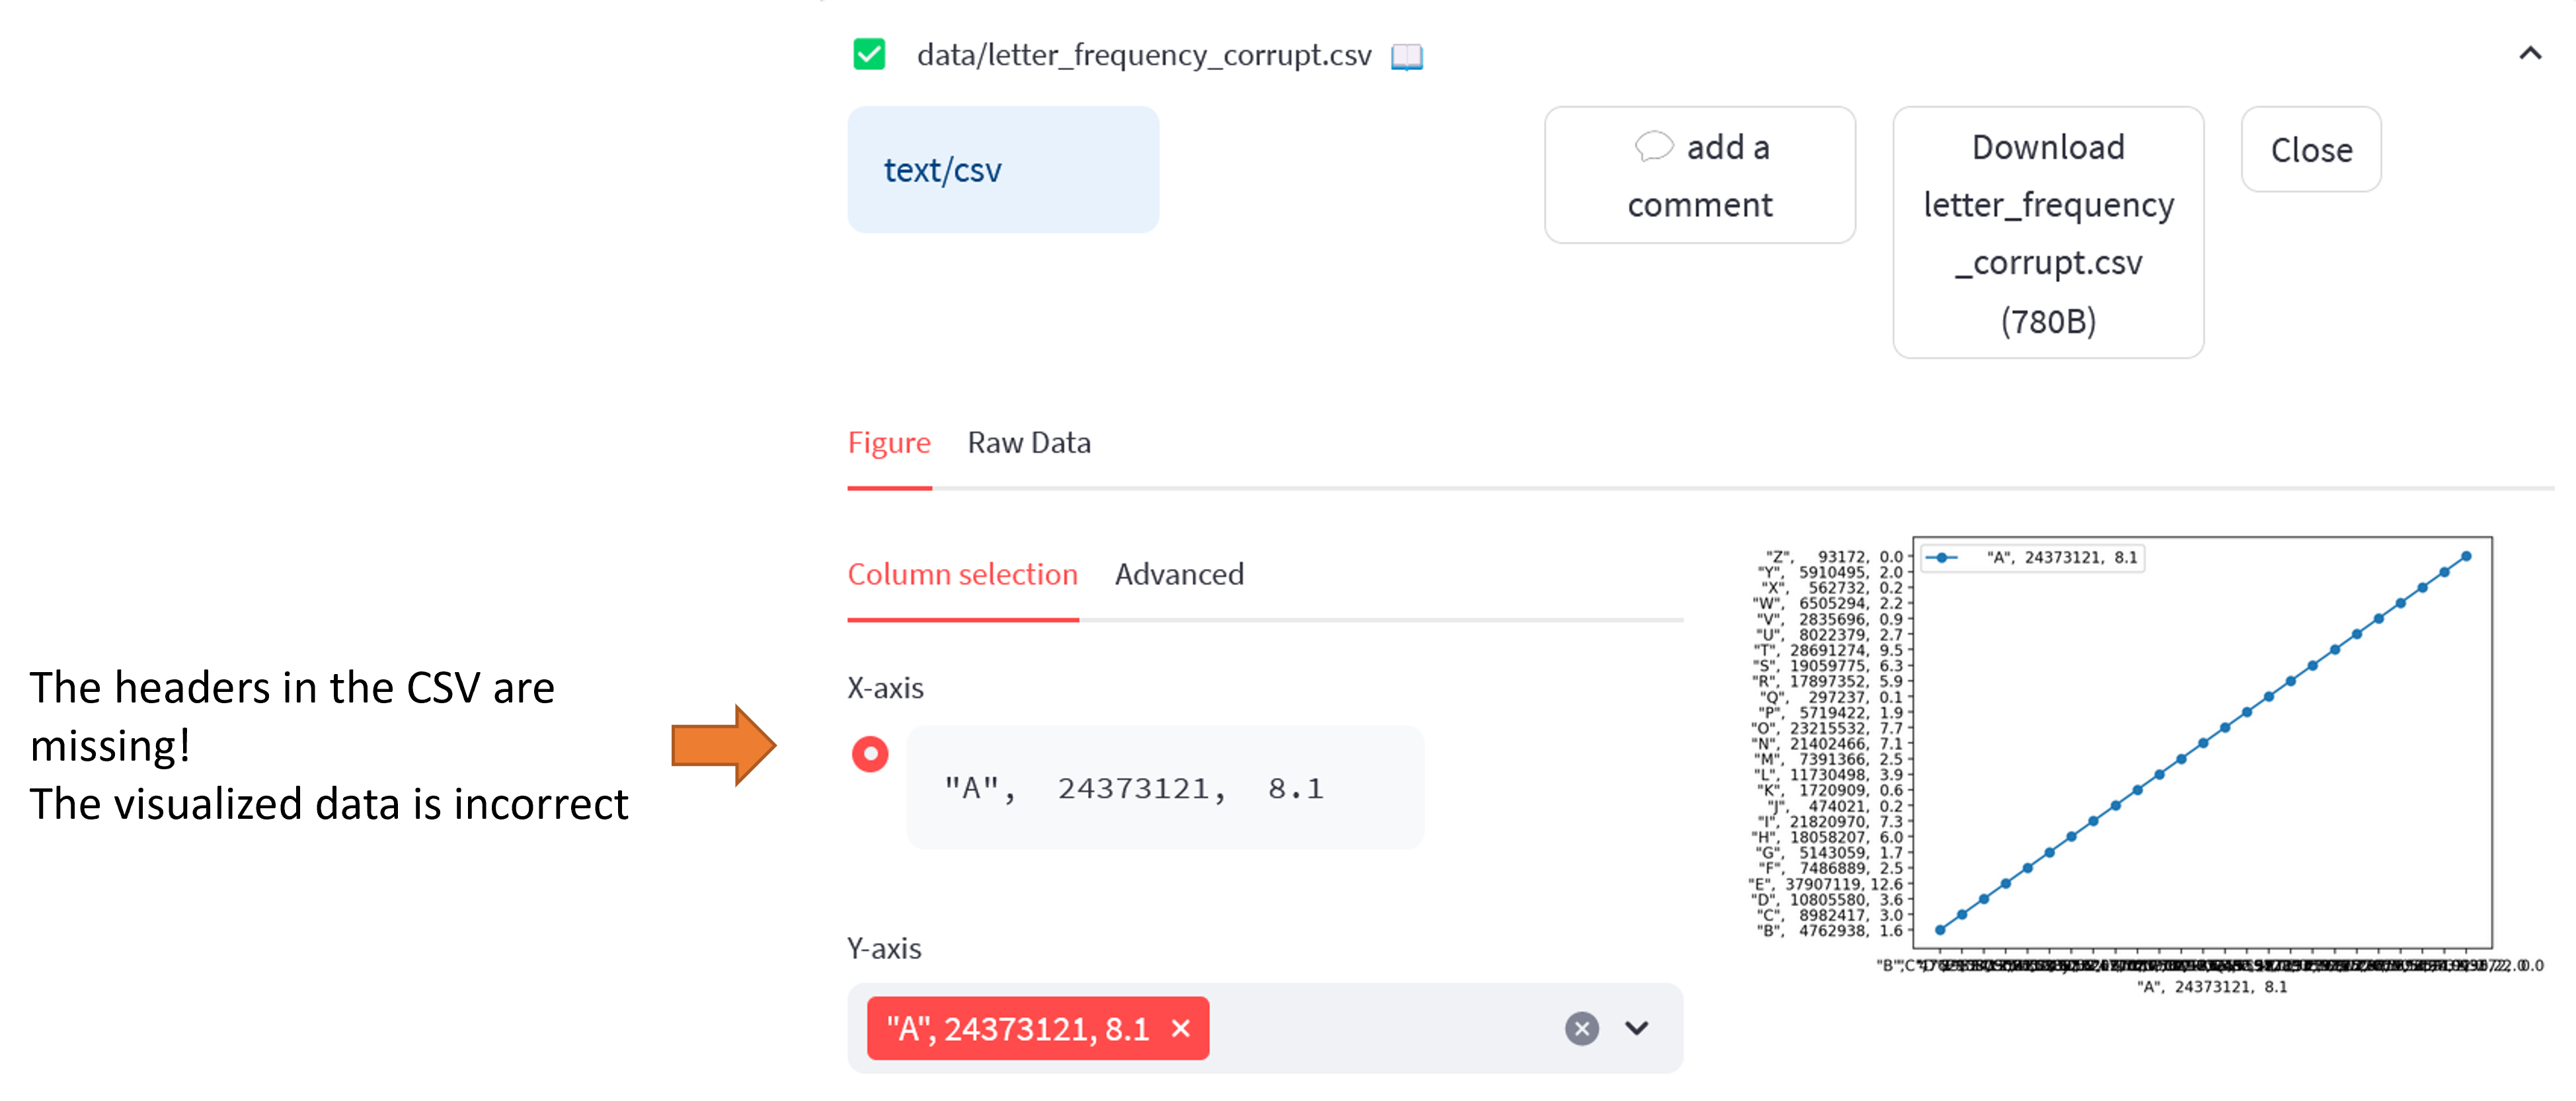
In the following, you can see the same file but with missing headers.
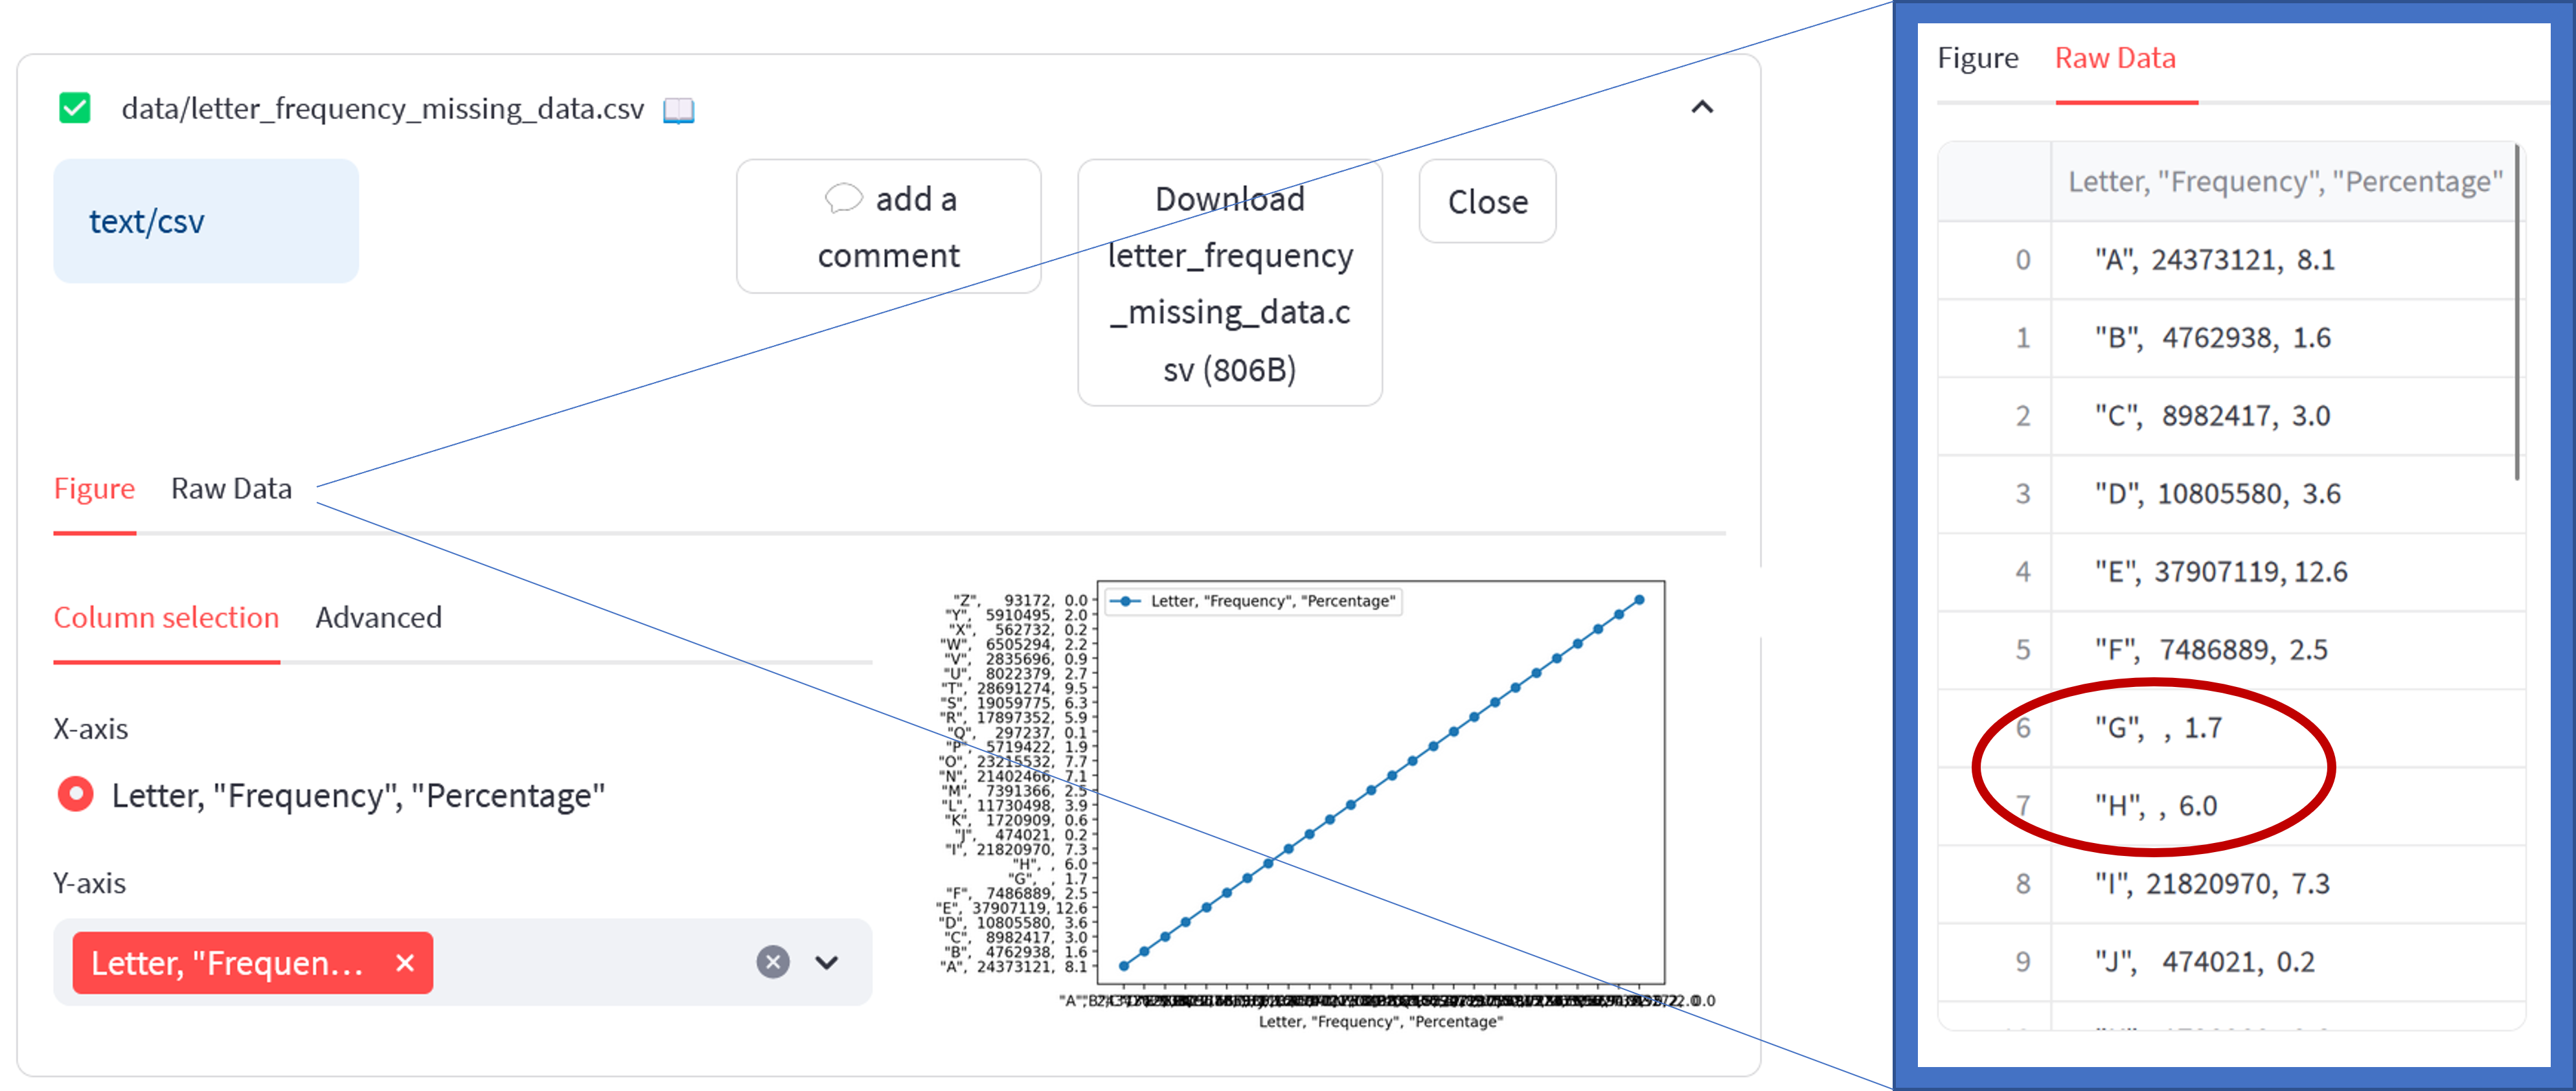
If you are missing data in your table, the plotting will also be incorrect. You can see this in the following image.
Pyvista mesh curation
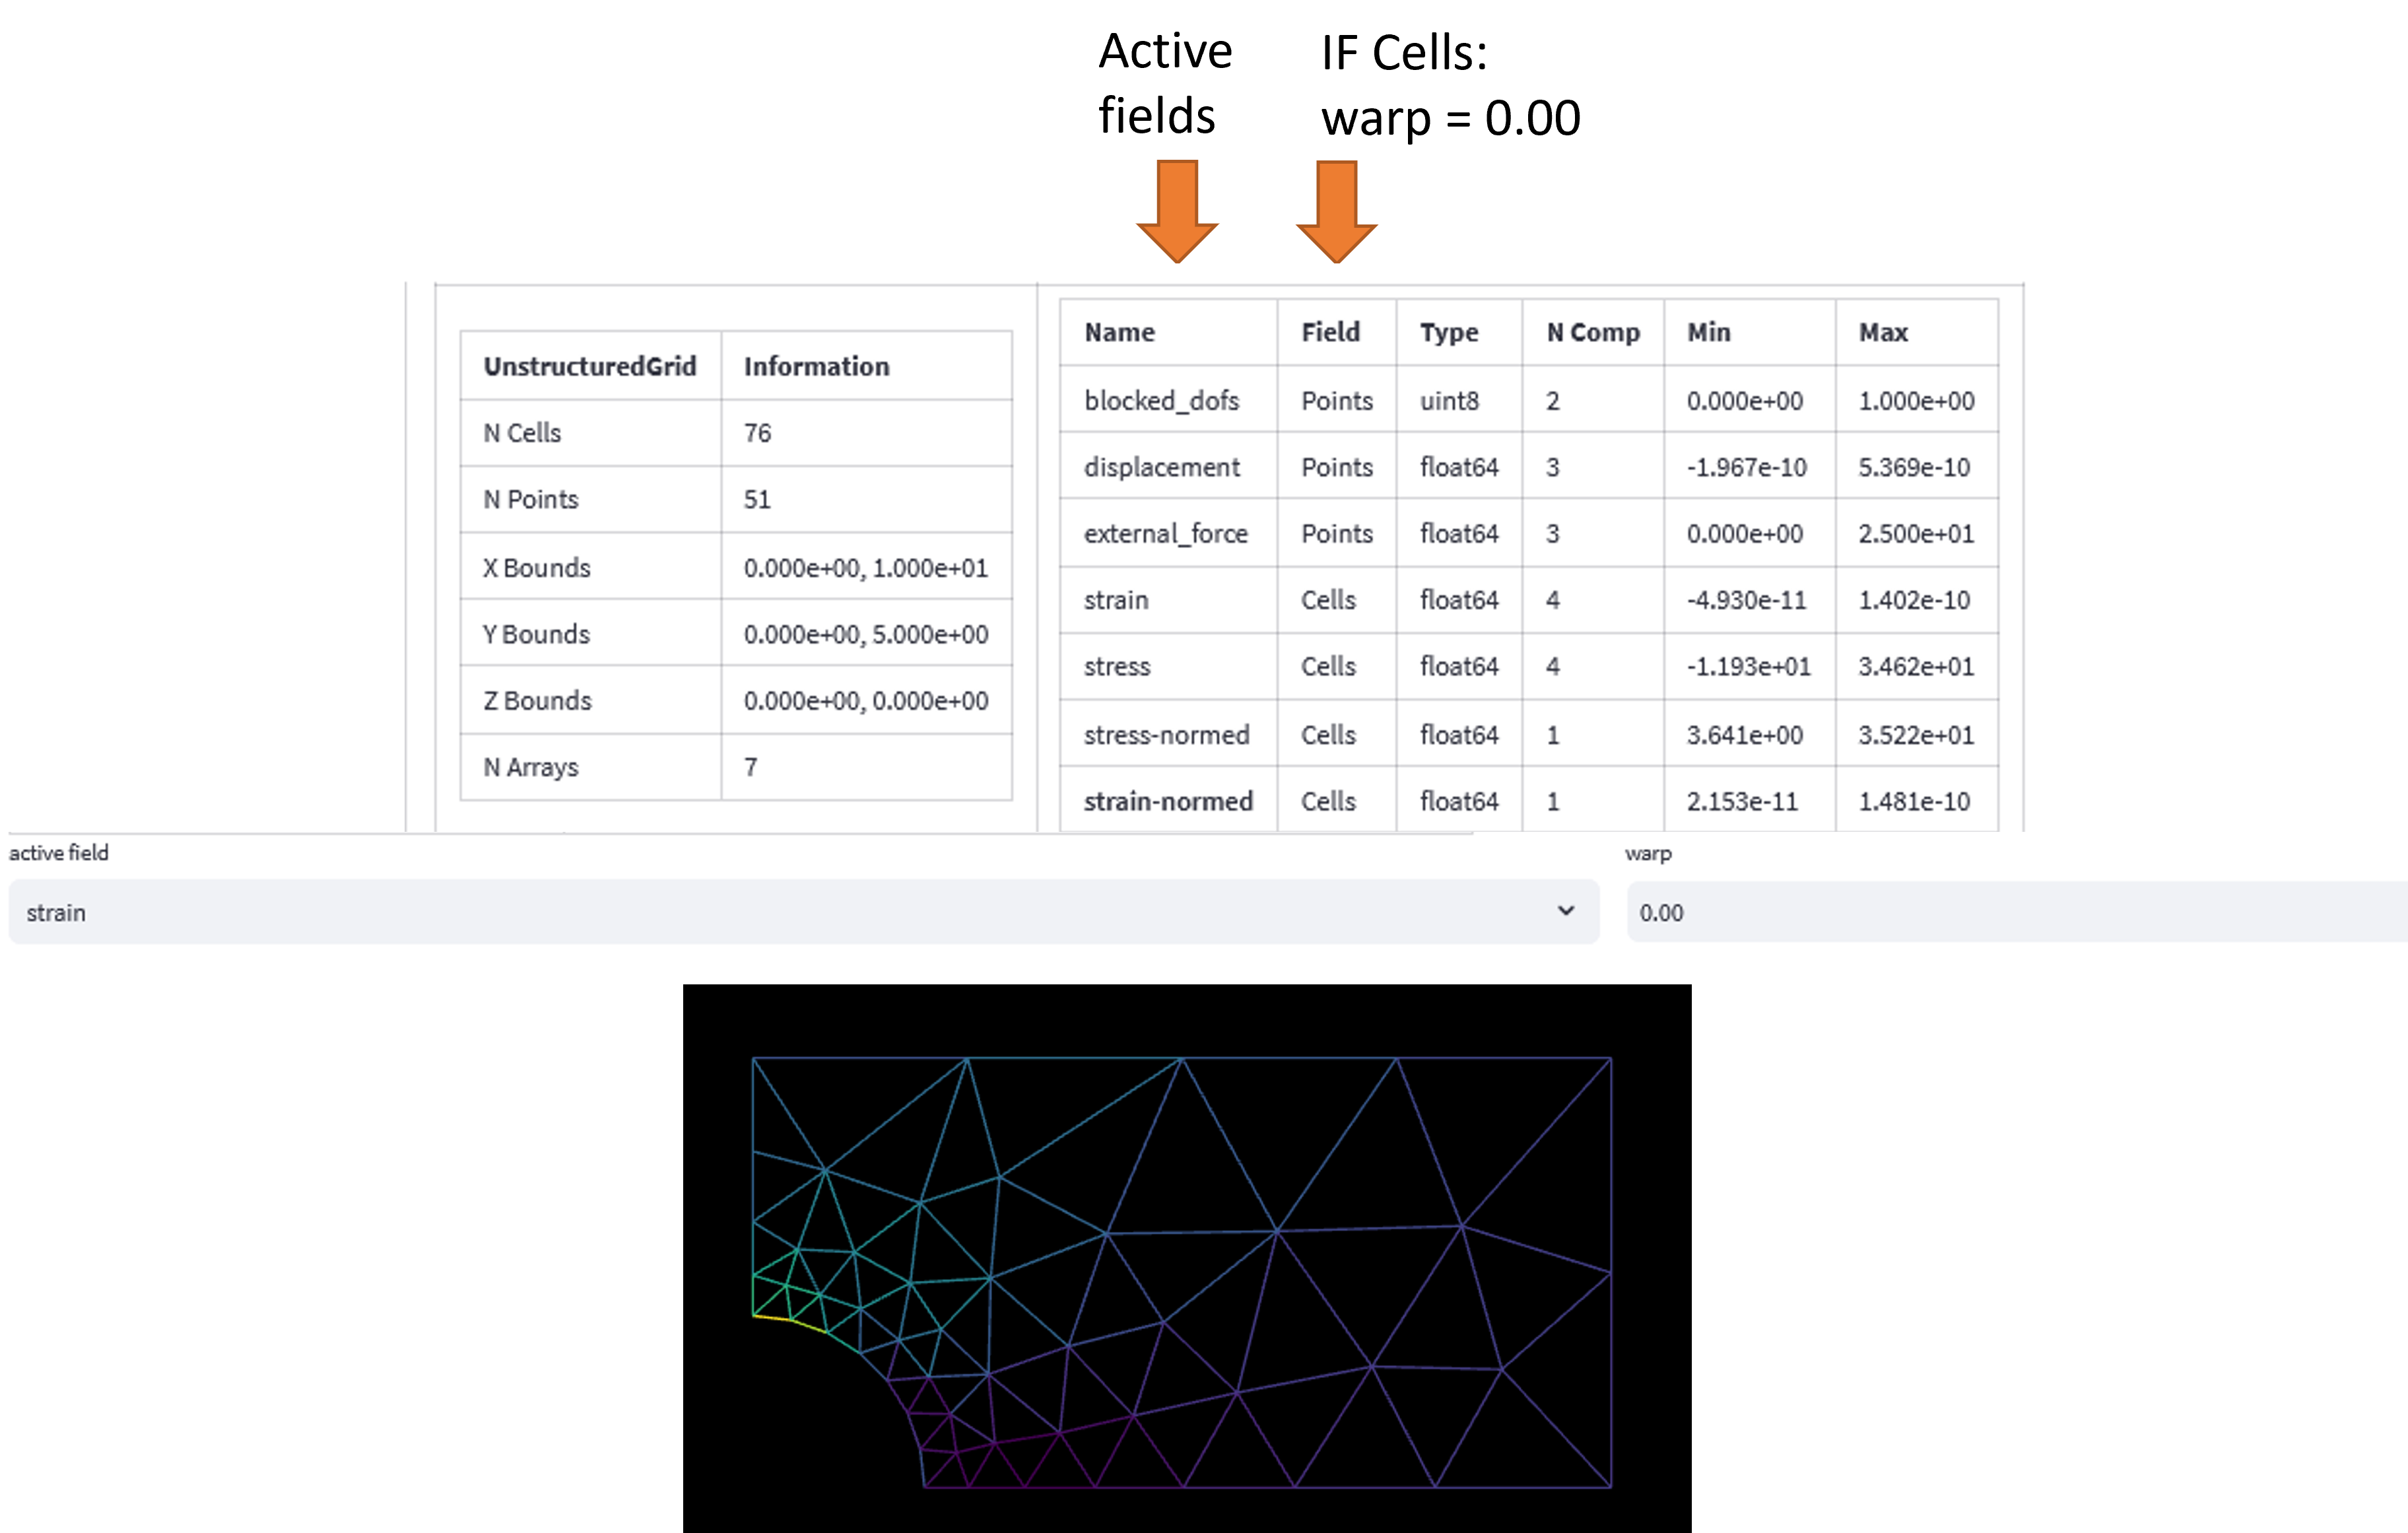
The mesh is visualized in the web report, so you can check if the mesh is correct.
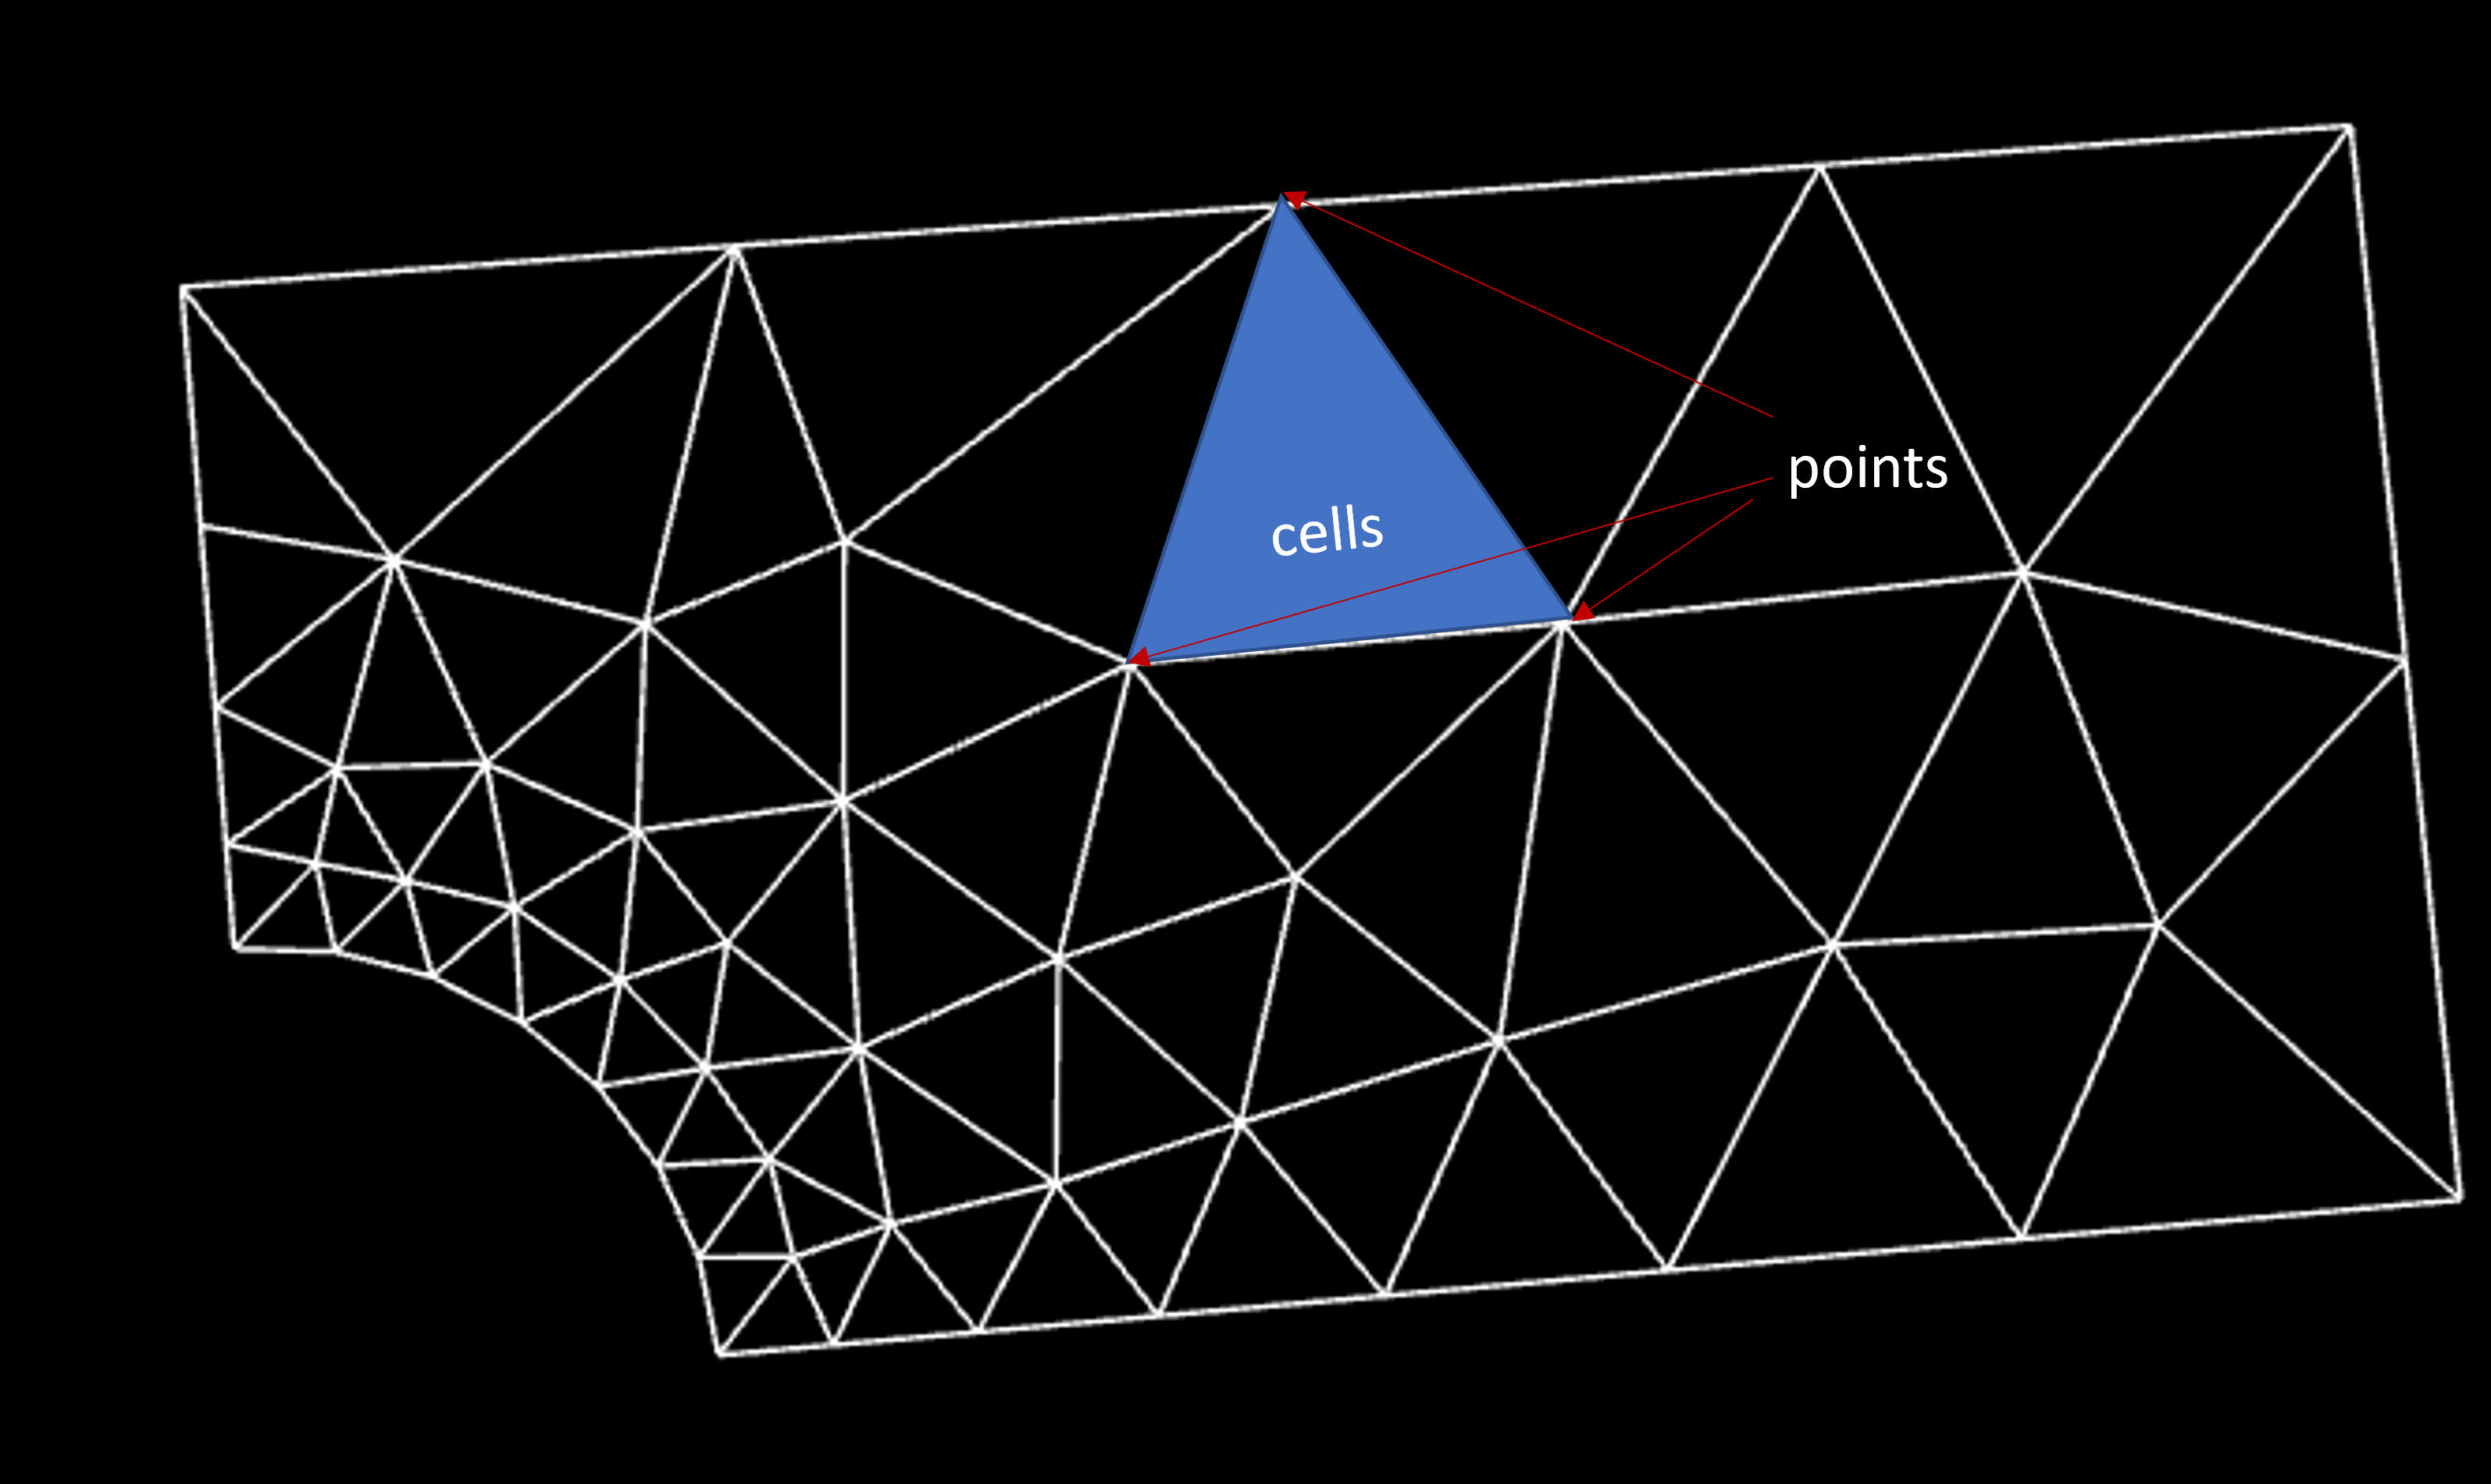
The mesh is composed of the following important parameters:
Cells: The volume within the points. Cells cannot be warped.
Points: Located on the corner of the cells faces. Points can be warped (make sure that the warping is done with the appropriate scale).
You can chose an active field (i.e. apply a force to the mesh) and see how the mesh is distorted.
Ontology
Solidipes will check that the whole dataset and its individual files conform to the selected ontology. By default, the base Solidipes ontology is used and includes some basic check:
presence of a README.md file,
header of csv files must contain units,
if workflows directory is present, it must contain files that describe the environment.
To change the used ontology, you can provide a Solidipes ontology identifier, which can be either a Python module (e.g. solidipes.ontologies.solidipes) or a path to a local Python file that contains Solidipes ontology classes, that can be included in your dataset (e.g. data/my_ontology.py). For more information on how to create your own ontology, please refer to the developer documentation.